Daily Brief by PromaxBDA has partnered with B&C and attention analytics company iSpot.tv on the weekly Promo Mojo chart, offering data showing the top five TV promos ranked by TV ad impressions. These are the shows networks have been promoting most heavily to drive tune-in. This week’s data covers the 7-day period through March 19.

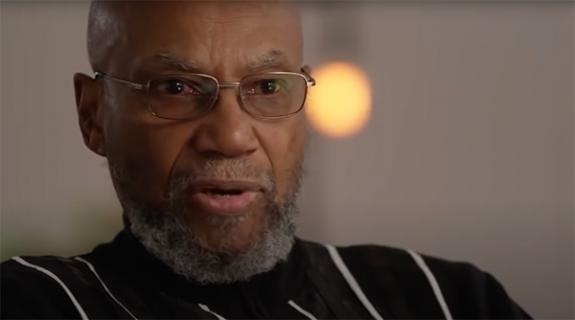
On the strength of 126.1 million TV ad impressions (down from 170.5 million in our previous ranking), NBC’s John Lithgow vehicle Trial & Error is No. 1 for the second week in a row. It just edges out Oprah Winfrey’s Greenleaf (OWN) at No. 2.

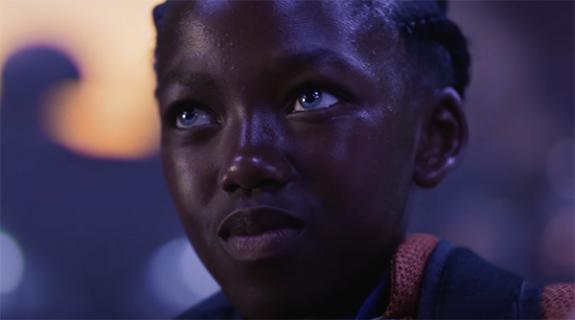
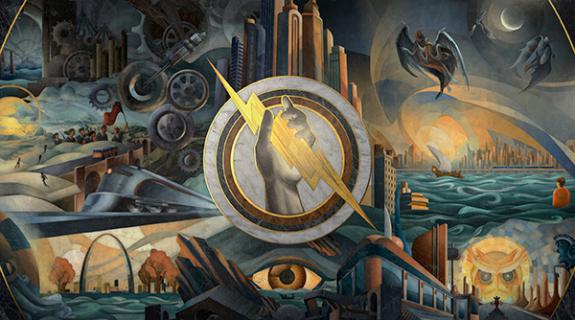
Other than Trial & Error and Dancing With the Stars (ABC) at No. 3, this is a top 5 weighted toward cable shows, with animated musical fantasy series Tangled: The Series (Disney Channel) and comedy adventure series Hunter Street (Nickelodeon) rounding out our ranking at No 4 and No. 5, respectively.

1) Trial & Error, NBC

Trial & Error, NBC
Impressions: 126,113,793
Imp. Types: National 87%, Local 9%, VOD/OTT 4%
Avg. View Rate: 83.54%
In-network Value: $411,812
Out-of-network Est. Spend: $2,543,869

2) Greenleaf, OWN Network

Greenleaf, OWN Network
Impressions: 123,356,732
Imp. Types: National 84%, Local 13%, VOD/OTT 3%
Avg. View Rate: 87.70%
In-network Value: $462,004
Out-of-network Est. Spend: $698,820

3) Dancing With the Stars, ABC

Dancing With the Stars, ABC
Impressions: 109,445,703
Imp. Types: National 79%, Local 18%, VOD/OTT 3%
Avg. View Rate: 81.25%
In-network Value: $124,282
Out-of-network Est. Spend: $2,400,711

4) Tangled: The Series, Disney Channel

Tangled: The Series, Disney Channel
Impressions: 103,955,069
Imp. Types: National 97%, Local 1%, VOD/OTT 2%
Avg. View Rate: 96.37%
In-network Value: $390,098
Out-of-network Est. Spend: $0

5) Hunter Street, Nickelodeon

Hunter Street, Nickelodeon
Impressions: 98,226,813
Imp. Types: National 98%, Local 1%, VOD/OTT 1%
Avg. View Rate: 92.39%
In-network Value: $294,878
Out-of-network Est. Spend: $294,878

Data provided by iSpot.tv, Real-time Advertising Metrics

Impressions - The total impressions within all US households including National Linear (Live & Time-shifted), VOD+OTT, and Local.
Imp. Types - Impression types tracked include National (Live + Time-shifted), Local, VOD & OTT. See below for further details.
Avg. View Rate - The average view rate across all views of a promo. The average view rate is only calculated on impressions that are viewed from the beginning of the promo.
In-network Value - Estimated media value of in-network promos.
Out-of-network Spend - The estimated amount spent on TV airing time for this promo’s spots during a given date range.
National: Live - A national promo which was viewed during live linear television broadcast or same day, via DVR or on-demand.
National: 3 Day Time-shifted - A national promo which was viewed on delay, via DVR or on demand up to 3-days after the original broadcast.
National: 4-7 Day Time-shifted - A national promo which was viewed via DVR between 4 & 7 days after the original broadcast.
National: 8+ Day Time-shifted - A national promo which was viewed via DVR 8 days or more after the original broadcast.
Local - A promo that was aired during a local ad break slot.
VOD - This includes promos that run in on-demand content past three days (i.e. do not contain the linear promo load)
OTT - On-demand streaming content (i.e. Hulu, Roku, Fire TV Stick, Chromecast).

Tags:


  Save as PDF