


__twocolumncontent.jpg)


Viewers spent about the same amount of time consuming media in 2018 as they did in 2017—about 10 1/2 hours per day—but where they are spending that time is changing, said Nielsen in its Total Audience Report for third quarter 2018.
Technologies experiencing the most growth are TV connected devices—streaming sticks such as Chromecast, smart TVs, and ever-present smart phones. Smart TVs have increased their reach by 9 percent, having been in 41 percent of homes in September 2018, compared to 32 percent in September 2017. Users are spending almost 4 1/2 hours on internet-connected devices such as game consoles, computers, smartphones and tablets.
As should be expected, young adults 18-34 spend the most time per day on their smart phones and TV-connected devices, more than any other group. That demographic increased their daily time spent on those devices by 23 minutes over the course of the year. That said, older adults aged 50-64 spend more time on media in general than any other demographic.
Internet-connected TVs and game consoles are also on the move. Both sorts of devices could be found in 68 percent of U.S. households in September 2018, up five percent from 63 percent in September 2017.
Streaming video on demand (SVOD) content is now available in 67 percent of U.S. households compared to 61 percent in the prior September. Eight out of ten Asian-American households, seven out of ten Hispanic households and six out of ten African-American households subscribe to an SVOD service, such as Netflix, Hulu, Amazon Prime and more.
Broadcast radio remains the largest media platform in the U.S. when it comes to reach, with 92 percent of all adults tuning in to traditional radio sometime during the week. But audio streaming—such as audio books and podcasts — is on the rise with 45 percent of all U.S. adults listening to on-demand streaming audio on a weekly basis.
With all of that content streaming in, viewers often find figuring out what to watch challenging, with about two-thirds of them relying on recommendations from friends and family to determine their next binge. They also tend to return to what they know, with 56 percent reporting that they consume more traditional broadcast content via these platforms, according to Nielsen’s MediaTech Trender Survey.
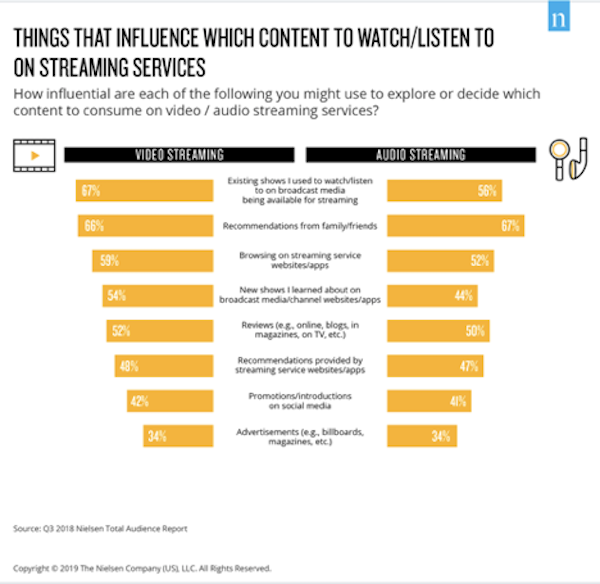
Even though streamers tend to rely on recommendations and familiarity, 57 percent of respondents said they like having access to a broad array of content, and 56 percent said they want to receive that content via platforms that are easy to navigate. Users are also looking for local programming (43 percent), specific networks (38 percent) and live sports (35 percent).
Tags: nielsen nielsen total audience report smart tvs smartphones